debugging kernel driver and understanding i/o routing with various structures
Let’s debug a very simple driver from pavel’s latest book on kernel programming and understand different structures along with their relationship and overall...

When kernel debugging an old target like Windows 7 after a long time using windbg. I noticed not being able to see the registers in register pane. That was kind of frustated at times, when there was a real need to have a look at them instead of doing an ‘r’ command each time in command window.
TL;DR
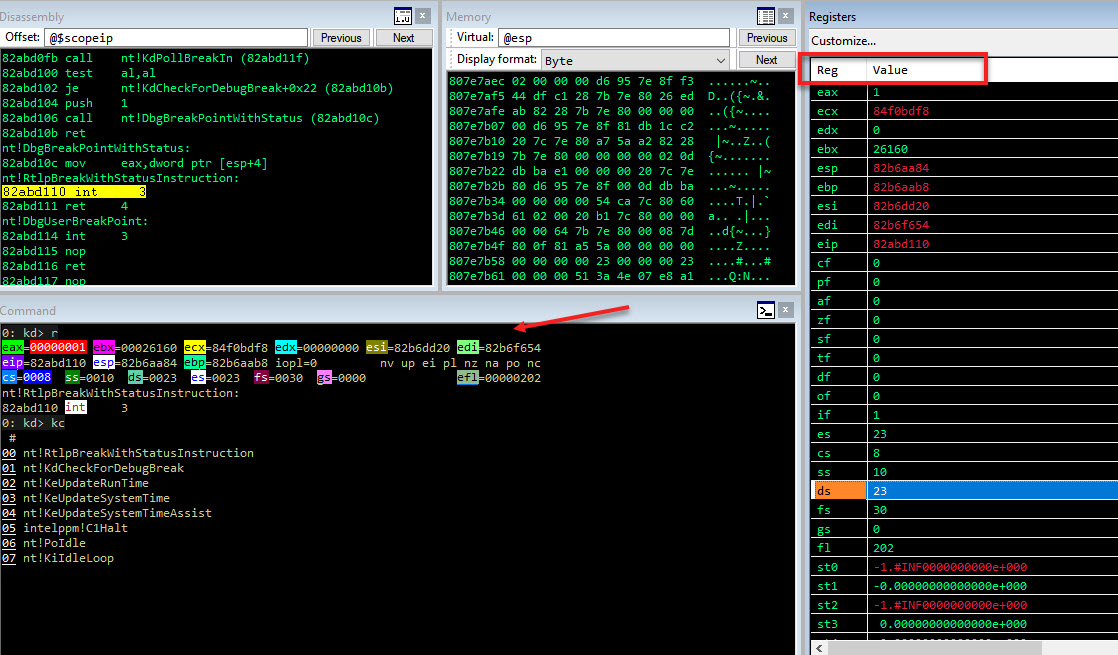
Here is a really neat windbg extension named wingdbg that solves the issue.
Copy the extension over to your extension path set via .extpath or default path.
.load wingdbg.dll
!regfix
Another alternative may be to find an old compatible windbg and work with that. Old Sdk Release
Let’s debug a very simple driver from pavel’s latest book on kernel programming and understand different structures along with their relationship and overall...
Let’s explore how nt!PoolHitTag can be useful for while tracking memory issues. Along with useful windbg command like !pool, !poolfind, !verifier etc.
In this post let’s explore the general mechanism of how we go for virtual to physical memory. Trying to understand what happens in between.
In the prev post we saw how to use phnt to access windows native api and undoc structures.
Quite often on windows accessing native api and undoc structures is required.
TL;DR This is taken from the mwri labs doc in links below. The vulnerability is in the function win32k!xxxHandleMenuMessages. When it calls the functio...
When kernel debugging an old target like Windows 7 after a long time using windbg. I noticed not being able to see the registers in register pane. That was k...